University of Tehran
Network traffic is quite complex. For example, consider Web traffic. When you type in a URL to your browser, many things that you are mostly unaware of happening behind the scenes. However, a Web session usually consists of more than just one session. Even if you only go to a single page, you will probably initiate several sessions. Each image you download is a separate session, as are other files that may be loaded by the page. After a few seconds of reviewing the page, you then select a new URL and the process starts over. In addition to these explicit sessions, there are generally DNS lookups that occur to obtain the IP addresses of the pages and images.
Thus, there are several levels to the network data. Within each TCP session, there are the individual packets, whose statistics are determined primarily by the network and hardware considerations. The number of sessions spawned by the main session is different for each Web page and thus has another distribution associated with it. Finally, there is the user input, which determines the time between new sessions.
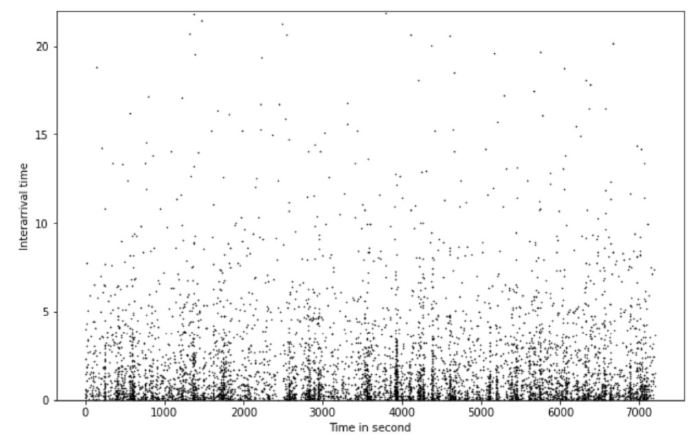
In the simplest case, we consider the initiation times of TCP user sessions. A basic probability course would tell us that arrival times are Poisson, so this is a good starting place. Note that it is also reasonable to believe that the rate is slowly varying (diurnal), and in fact several groups (Paxson and Floyd [1995], Nuzman et al. [2000]) have found that (some) user session initiation times are well modeled by a Poisson distribution with a slowly time-varying rate.
Programming Language: Python
Course: Performance Evolution of Computer Systems Course
Results